At Advisor, we’re constantly looking for ways to make the financial advisor matching process easier for both our advisor partners and for people seeking financial advice. A byproduct of that customer-driven mindset is that we collect an immense amount of data, which we then use to help inform our product updates, marketing approach, and our partnerships.
We reviewed the data from 18,950 people who completed our online advisor matching quiz and we’ve compiled our findings here.

Advisor.com pairs people seeking financial advisors with advisors on our network. Outside of carefully selecting the platforms where we find those looking for financial advisors, we qualify our traffic using a proprietary matching quiz. Financial advisors tell us their ideal client, people looking for financial advisors tell us about themselves and what they need in a financial pro, and we connect the two.
The data in this post comes from self-reported answers to our financial advisor matching quiz; only data from those who completed the quiz is used. We have removed outliers and leads marked as fraud. In some cases we have omitted categories where the data is too sparse to be relevant or otherwise made modifications for clarity; if we’ve changed the data in any way for a particular analysis, this is noted in that section.
The questions on our matching quiz help us better understand who is searching for a financial advisor and what they need in that professional. The following are the basis for our analysis:
These are the quiz areas we analyzed. Click on any to jump to its section:
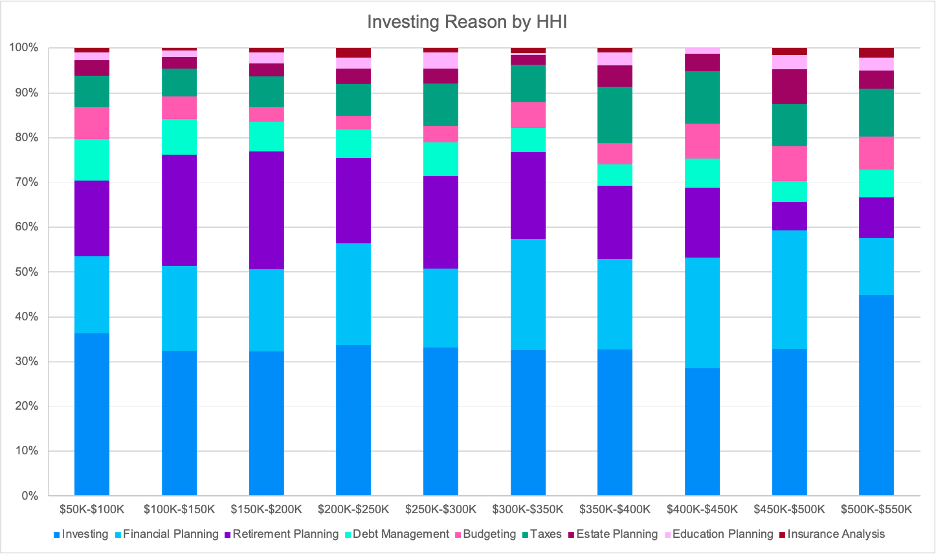
Our quiz allows people to select up to nine reasons for wanting a financial advisor: investing, financial planning, retirement planning, debt management, budgeting, taxes, estate planning, education planning, and insurance analysis.
The reasons people choose to seek out a financial advisor are similar across HHIs, though there are some variations at the highest and lowest brackets. This is mirrored with age, and minor differences are likely driven by lifestage variations.
Financial advisors already gravitate towards the mid to higher age brackets as this is where wealth has had a longer time to accumulate and people in these life stages are more readily seeking advisors.
However, slight variations in a cohort’s intent could lend themselves to specialization opportunities (e.g. focusing on estate planning for ages 70+ or debt management and budgeting for 20-39).
Our quiz allows people to select multiple reasons for investing. For the purpose of streamlining the analysis, we’ve focused on people who only selected one reason. We looked at data for up to three reasons (~70% of the total results) and the top reasons for investing don’t change significantly as people select more options.
We have omitted HHI less than $50K and above $1M due to data sparsity. With very few fluctuations, the top reasons for seeking a financial advisor across household income brackets are investing, financial planning, and retirement planning.
Tax management becomes more relevant at household incomes exceeding $250K; budgeting is relevant for the lowest HHI bracket of $50K-$100K and for brackets above $400K.
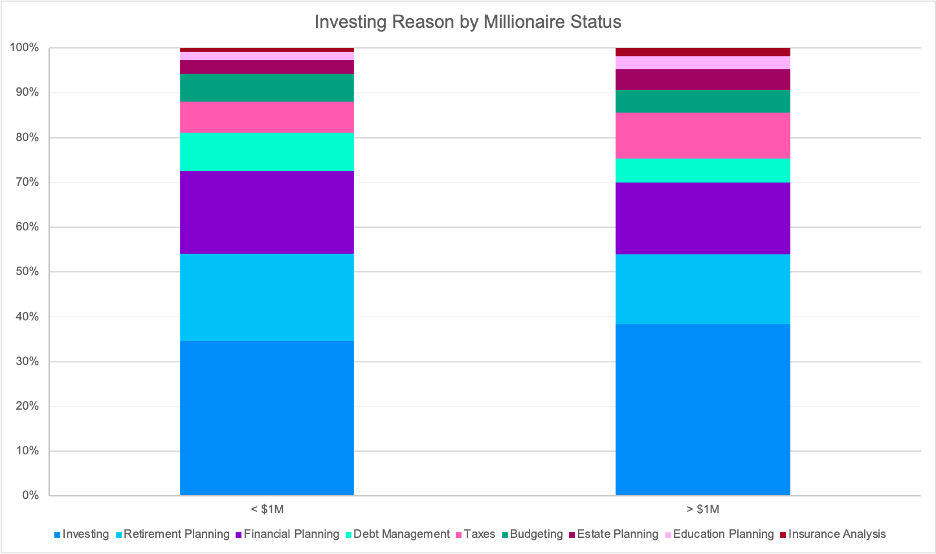
We divided the data into people who self-reported that they had $1M+ in total assets (retirement accounts, cash, investing, property) vs those who had less than $1M. We also looked at $1M in investible assets (cash, investments) and the results were the same.
Differences between the two groups are not extreme, though millionaires are less focused on debt management and more focused on tax management than those who reported having less than $1M.
With the exception of ages 50-69, investing is the most popular reason for working with a financial advisor. For the 50-69 cohort, retirement planning is the priority.
We see a few pockets of variation by decade: estate planning is popular with people 70 and older, budgeting is less important for 50+, and retirement planning is less of a priority for people 18-29. Outside of these areas that coincide with life stages, the reason for investing is relatively consistent across age ranges.
Higher HHIs, millionaires, and business owners are more likely to have financial advisors. Generally speaking, the percentage of respondents with advisors is also positively correlated with age. The youngest cohort is the only exception to this pattern, but that could be due to limited data.
While groups with the highest amounts of investible assets are already a focus for advisors, there may be longer-term opportunities to engage and nurture cohorts outside of the typical ranges (younger, lower HHI) that have growth potential.
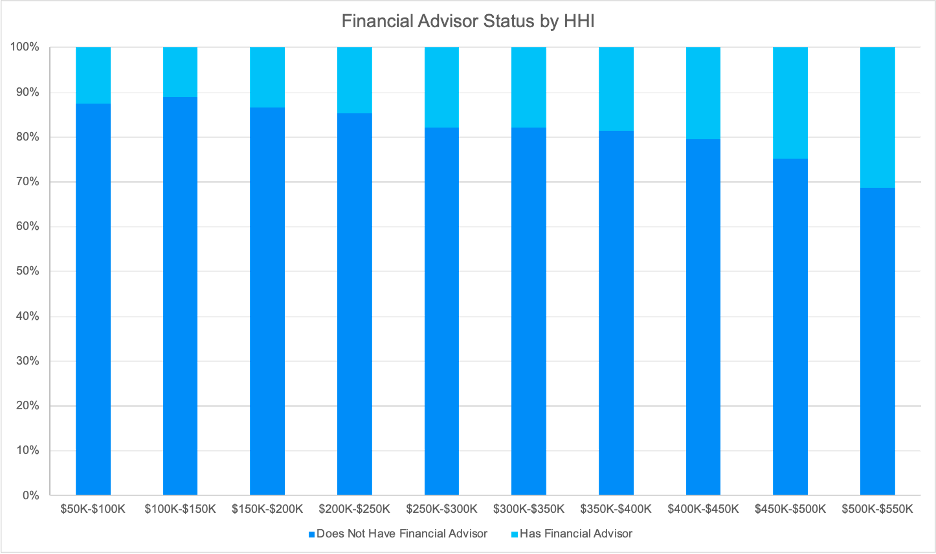
HHI below $50K and above $1M have been omitted due to limited data. We’ve divided the HHI brackets in $50K intervals.
In general, HHI and having a financial advisor are positively correlated. With very minor exceptions, the percentage of people who said they currently work with a financial advisor increases as the HHI does.
HHI brackets from $50K to $250K have similar percentages of having a financial advisor (~11-14%). This is true for $250K-$350K as well (17-18%).
Once we get into the $400K+ range though, the percentage of respondents who say they have an advisor starts accelerating – 20% for $400K-$450K, 25% for $450K-$500K, and 31% for $500K-$550K.
As expected, people with $1M+ in total assets are more likely to have a financial advisor. ~32% of millionaires have a financial advisor compared to ~12% of non-millionaires.
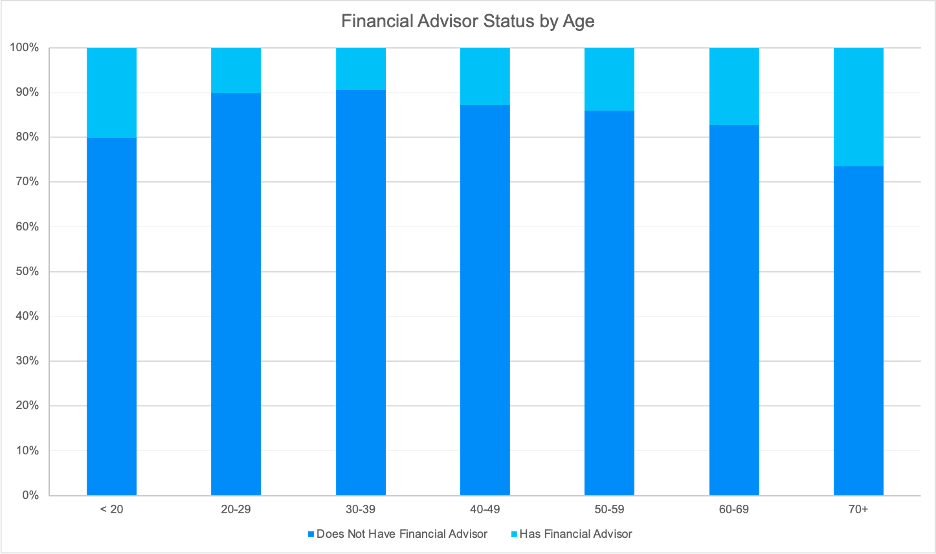
At ~10%, the 20-39 age cohorts are the least likely to have an advisor. The percentage of people with advisors starts ticking up at 40-49 (13%) and rapidly increases for 60+ (17-26%).
One unusual finding is that the 18-19 cohort (our quiz does not accept people younger than 18) is more likely to have an advisor than the 60-69 group. Note that the 18-19 year-old respondents represent less than 3% of the total data. This relatively high percentage could be a result of limited data, or it could be a self-selection bias; the kinds of 18-19 year-olds who would take a financial advisor quiz may be more likely to already have advisors.
We’ve divided the data into four regions: Midwest, Northeast, South, and West. Puerto Rico was omitted due to limited data.
The differences in financial advisor status by region are insignificant; about 85.5% of respondents in the Midwest and South do not have an advisor while this number is 86.5-87% for the Northeast and West.
Business owners are more likely to have a financial advisor (27%) compared to non-business owners (10%). They’re also more likely to be millionaires, which coincides with the finding that a higher percentage of millionaires have advisors.
The Midwest and South have the highest concentration of lower HHIs, but the South also has the highest concentration of millionaires (alongside the West).
Across regions we found gaps in household income brackets. Most respondents were in the low to lower-mid HHI buckets or extremely high, with not many people falling in the middle.
HHI should be weighed against other factors, since it doesn’t tell the full story of net worth.
Additionally, if you’re using HHI as a signal and you notice different behavior at the upper tiers, it could be useful to tailor content to the very high HHI ($500K+) or the lower brackets, because there aren’t many people in the middle.
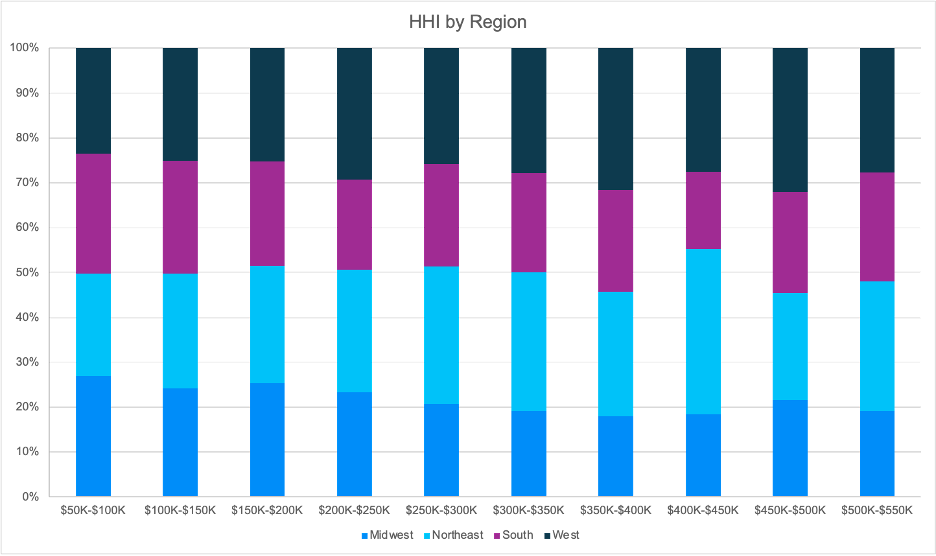
Puerto Rico was omitted from all analyses in this section. For the HHI part, less than $50K and above $1M were removed.
Given regional differences in cost of living, it’s not surprising that the Midwest and South had the highest percentage of respondents with HHI in the $50K-$150K range (~54% compared to 45-47% in the Northeast and West).
Across regions most people fall into HHI brackets of $350K and below (92-95%), and the vast majority of those are at $150K and below (63-71%). There’s a gap in the $350K-$500K range where brackets at $50K intervals make up ~1% of the total, but that jumps to 3-4% at $500K+.
.png)
We looked at percentages when we defined “millionaire” as the sum of total assets (retirement accounts, cash, investments, property) or by the more liquid assets (investments and cash). The percentages change slightly, but the overall story does not.
The South and West have a slight edge on percentage of self-reported millionaires (by either definition). Using total reported assets > $1M, this is true for 19.36% of respondents in the South, 18.82% in the West, 17.23% in the Northeast, and 16.97% in the Midwest.
It’s also notable that the highest percentage of people ages 60+ and retired live in the South. This is likely part of the reason we see lower HHI in this region but a higher percentage of millionaires.
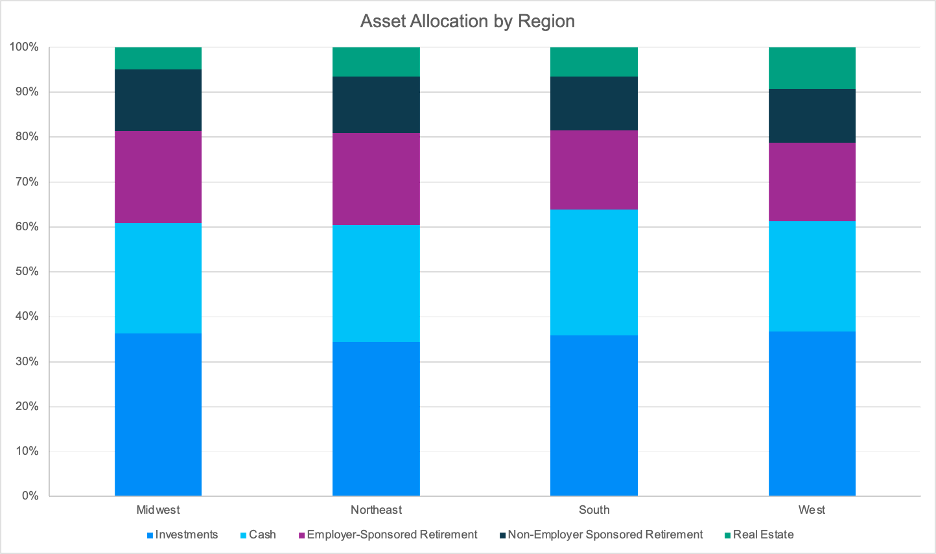
There aren’t as many convenient groupings in asset allocation by region, so each is detailed separately.
Midwest: Has the lowest concentration of net worth in real estate, but some of the highest percentages in retirement accounts. This region is younger than the West and South, so they may not have had resources to purchase a home yet.
Northeast: Has one of the highest percentages in employer-sponsored retirement and a healthy percentage in cash. Has the smallest percent in investments of the four regions. The Northeast has the highest percentage of people younger than 40.
South: Has the highest percentage in cash of the four regions and is low in retirement accounts (employer-sponsored and non). Could potentially be due to the higher concentration of older respondents shifting assets into fixed income and/or drawing on retirement accounts.
West: Has the highest percentage in real estate and investments of the four regions and is among the lowest for retirement and cash.
All but one of the states with the highest concentration of millionaires is within the South, and this is consistent with overall regional findings. In addition to typical hotspot cities like New York, Chicago, or Los Angeles; advisors seeking new clients with high AUM should focus on the Southern region.
For this individual state analysis, we removed states that had fewer than 300 respondents. Our data does skew heavily towards the Big Four states of California, Florida, Texas, and New York; it’s more limited in many of the less populous states. Because of that, data in this section is better viewed as an emerging pattern rather than something on which to make strategic decisions.
When we define “millionaires” as people with over $1M in cash and investments; South Carolina, Florida, Texas, Georgia, and North Carolina have the highest concentration. The percentages of respondents of millionaire status in these five states ranges from 10.46% in North Carolina to a high of 11.71% in South Carolina.
.png)
When we instead define “millionaires” as people with over $1M in total assets (cash, investments, retirement accounts, real estate), we see a shift in two of the top five states. Florida, New Jersey, Virginia, Texas, and South Carolina take the top spots ranging from 19.30% in South Carolina to 20.94% in Florida.
.png)
Because of the large number of respondents for Florida, New Jersey, Texas, and Georgia we have confidence in these percentages. Virginia, North Carolina, and South Carolina have fewer respondents and results there should be viewed more skeptically.
There are meaningful differences in advisor location preferences. Younger respondents tend to prefer remote options, while older respondents are more likely to be unsure or prefer in-person.
There are also some differences by HHI and millionaire status; people with very high HHI are the least likely to say they’re unsure, and millionaires are more likely to prefer in-person. That said, remote is the preferred option across all HHI brackets and for millionaires.
Advisors may consider tailoring their services and advertising approach to these different preferences. This could look like only advertising in places that have a physical presence, traveling to clients as needed, or taking a digital-first approach for younger prospects.
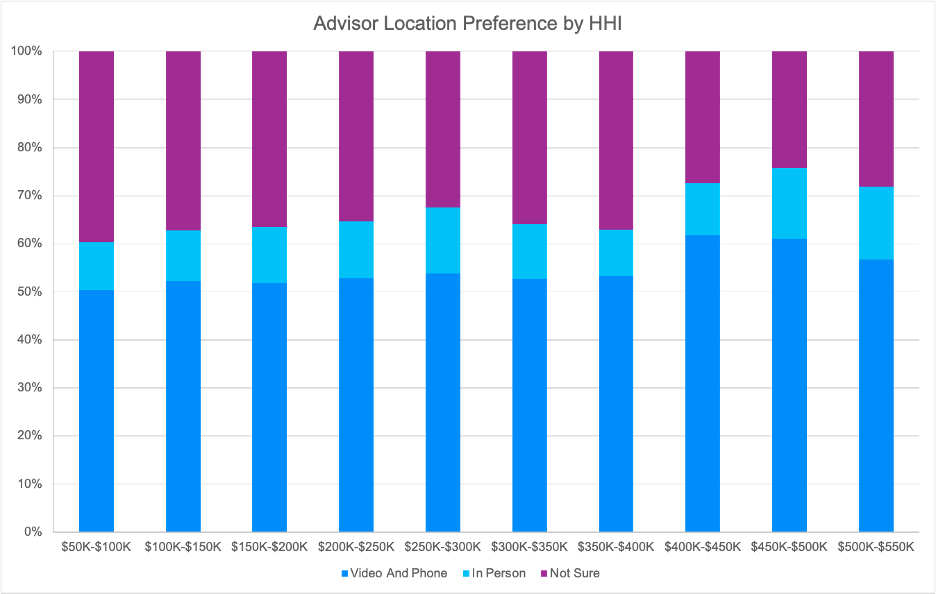
For the HHI section, we’ve omitted <$50K and $1M+.
There are no meaningful differences in remote vs in-person advising by region. All regions are very similar to the total data, which indicates that just ~11% of people know they want an in-person advisor, ~52% want someone remote, and ~37% aren’t sure.
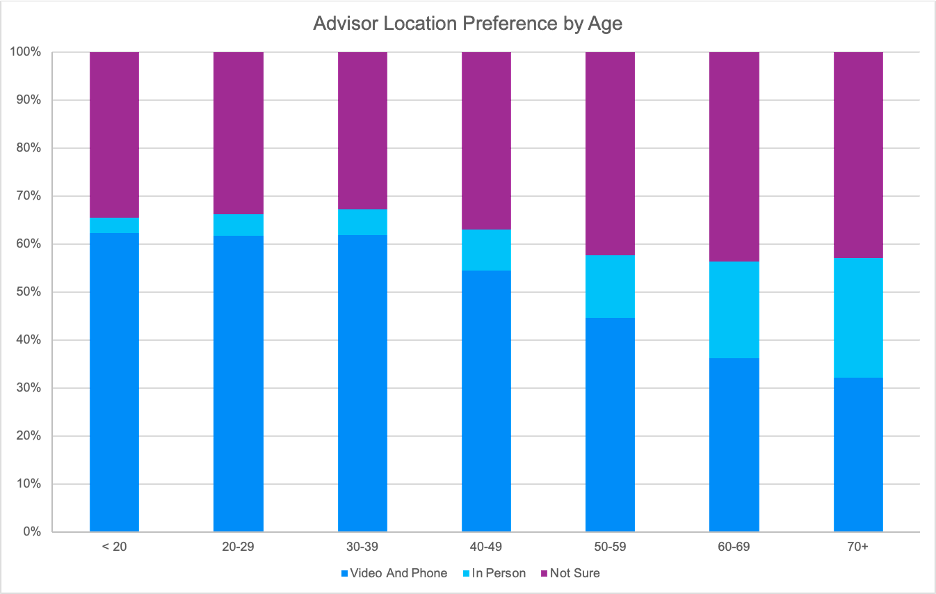
In contrast to the last section, there is a clear connection between age and preference for a remote advisor. The younger the respondent is, the more likely they want a remote advisor.
As people reach higher age brackets (starting around 50), sentiment shifts towards in-person or not sure rather than remote.
Millionaires are also more likely to be interested in an in-person advisor, though virtual is still the preference. About 9% of non-millionaires want someone in-person compared to 25% of millionaires.
HHI does not make a difference in advisor location preference until the $400K mark. Beyond that, people are more likely to want a remote advisor and also more likely to want in-person – the indecisive “not sure” subset drops.
We hope this deep dive into the data behind who’s seeking financial advice offered you a few surprises, useful takeaways, or even some inspiration for how you navigate client acquisition and service. Whether you're thinking about tailoring your messaging to different income brackets, exploring regional targeting, or considering an expansion of virtual offerings, the patterns we’re seeing can help shape a more strategic approach.
If you have questions about the data or are curious about how Advisor can support your growth, we’d love to talk or schedule a demo.