In part one of this data analysis, we reviewed quiz data from 18,950 people who completed our financial advisor matching quiz. In this post we’re continuing our analysis on these profiles, but looking exclusively at data related to schedules and closes.
For those of you who aren’t familiar with Advisor.com, we’re a financial advisor lead aggregator service. We reach people who are looking for financial advisors via advertising, they complete our matching quiz, and we connect them with relevant partners based on their answers to the quiz and the ideal client profiles we receive from our partners.

The scheduled and closed data presented here is from information that financial advisor partners have reported back to us. Not all partners have the same definitions for these KPIs, so we have isolated our scheduled and closed datasets to only partners who report this data consistently and calculate it in the same way.
Click on any of the following links to jump to the analysis section.
If you’re coming directly from the first part of this data analysis, you may notice that the way we divide HHI, age, and AUM brackets in this post is different from the last one.
Because schedule and close data are more limited than the total volume of leads, we’ve consolidated HHI and age range buckets to more easily identify patterns. We’ve listed below how those buckets differ from what we used in the quiz data post:
HHI: The quiz data section separated groups in intervals of $50K; in this post, HHI is divided into <$50K, $50-120K, $120-250K, $250-500K, and $500K+
Age: Quiz data separated 18-19 and 20-29; we’ve consolidated those groups here. Quiz data also separated 60s from 70+, but we’ve combined those ranges into 60+.
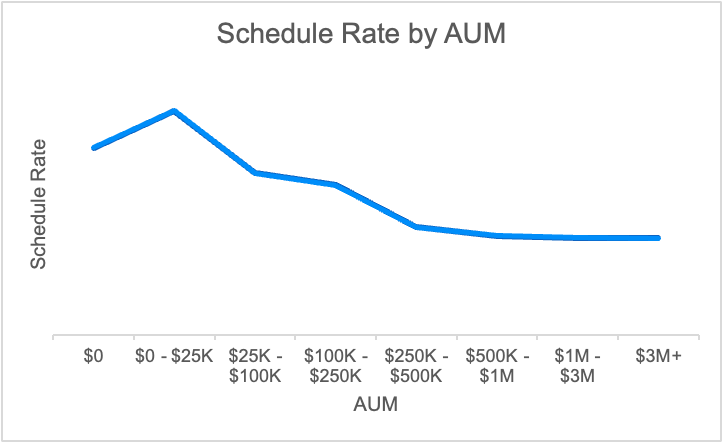
AUM: In contrast to HHI and age, we’ve gotten more granular with AUM. Instead of looking at millionaires vs non, we divide AUM buckets into $0, $0-25K, $25-100K, $100-250K, $250-500K, $500K-1M, $1-3M, and $3M+.
We see a clear pattern for schedule rate: As AUM increases, schedule rate declines.
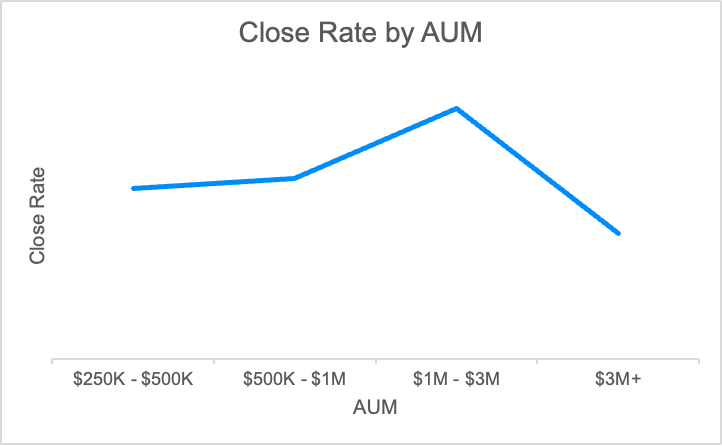
Close rate follows the opposite pattern, except at the highest AUM; we’ve omitted AUMs below $250K due to limited data. From $250K to $3M, close rate increases as AUM increases. $3M+ bucks that trend and close rate declines.
There are a number of reasons that could explain this pattern. It’s possible that people who are just getting started with investing and finding a financial advisor are less discerning about who they schedule with; their interests in a financial advisor do tend to be less nuanced (fewer non-millionaires want specialized services in things like estate planning or insurance analysis).
Higher AUM people are also more likely to already have a financial advisor, so there is the added friction of having to leave one relationship before starting another that may delay or eliminate scheduled calls. We see that across almost every bracket, those who already have an advisor schedule with a new one at lower rates.
On the close rate side though, once a higher AUM prospect gets in the door with a scheduled call, they’re more likely to close (up until the $3M+ AUM bracket). This might be because they already have a clearer idea of what boxes need to be checked and/or if they had an advisor before, they were already motivated to leave. Additionally, the higher AUMs likely close at higher rates because many advisors are more willing to take on clients who meet certain AUM thresholds.
The $3M+ AUM bracket has a lower close rate than some lower brackets though. This could be from the influence of competition; these prospects will often have the most options.
With the exception of people who are already retired, there is a positive correlation between HHI and AUM. Because of that, we see similar performance in schedule and close rate by HHI as we do for AUM: Excluding HHI <$50K (where more retirees are concentrated), schedule rate decreases as AUM increases. Close rate also tends to be higher as HHI increases.
Age also positively correlates with AUM and we see the same pattern. Younger cohorts schedule at higher rates, but close rate increases with age. This is true of close rates up till the 60+ category, where we see higher concentrations of very high AUM.
The differences in schedule and close rates by business owner status is less than 0.4 gross percentage points. This indicator does not seem to be significant for either KPI.
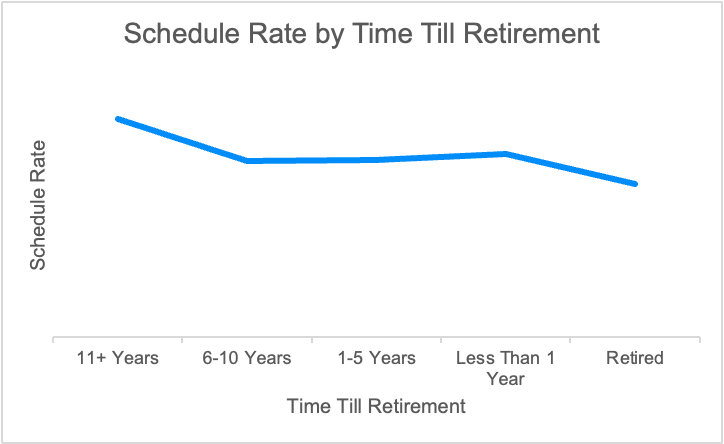
Schedule rate is highest for those with more than 11 years until retirement, about the same for less than a year till retirement up to 10 years away, and lowest for people who are already retired. This pattern is likely from the interactions of age, AUM, and financial advisor status from previous sections – those with higher AUM are also more likely to be older and already have an advisor, and they don’t schedule as often. Younger people with a longer runway till retirement often have fewer assets and lower AUM, but they schedule more frequently.
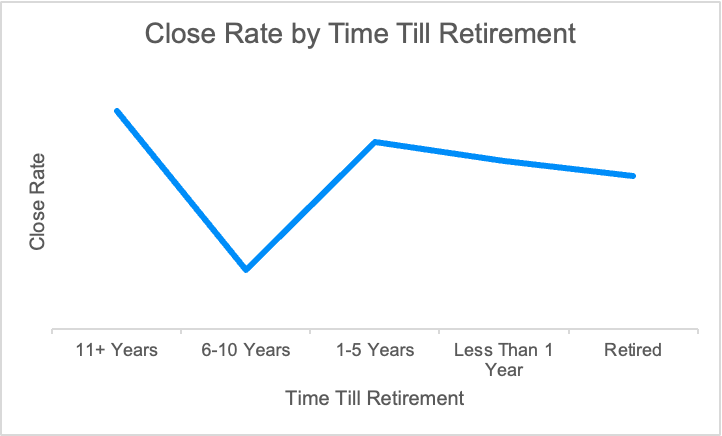
Close rate by time till retirement diverges from the trends. We see a high propensity to close in the 11+ years till retirement bucket, the lowest likelihood in the 6-10 years bucket, and very similar moderate close rates for everyone retired or within 5 years of it.
Digging deeper into the 11+ years till retirement and the 6-10 years categories, some interesting patterns emerge.
For the 11+ year category, people in their 30s and 40s make up the majority, and it’s the ones who do not have financial advisors that are pushing close rates up. This is true even of lower HHI buckets in the 30s and lower AUMs in the 40s. These decades are often when people are coming into their prime earning years, and they may be more motivated to work with an advisor.
With few exceptions, the 6-10 years from retirement category has a very low close rate across all age decades, AUM, and HHI. It’s possible that this group has moved beyond the lifestage associated with the 30s-50s where people are motivated to find an advisor, and they are now sticking to their current financial plan.
As people get nearer to retirement (within 1-5 years), they may have been less satisfied with performance from when they were 6-10 years out or their priorities might have shifted, thus prompting them to seek a different advisor.
Leads can either be bought as exclusive matches or as multi-matches. Exclusive matches are only purchased by one financial advisor or their firm, whereas multi-matched leads can be sold to either two or three financial advisor partners.
As we might expect, exclusive match leads have a higher schedule rate than multi-match. However, once a lead schedules, the close rate of multi-match and exclusive match leads are similar. That difference is ~9.5% in favor of multi-match, but is only a change of 0.51 in gross percentage points.
This data suggests that if you’re buying multi-match leads, energy should be focused largely on getting that first scheduled call – make it as easy as possible for a lead to schedule with you on their own and make sure you have a stellar follow-up and nurture process. Once they’ve made that first connection, the multi-match leads should close at similar rates to your exclusive leads.
The data we have presented here is an aggregation from select partners; when we look beyond the averages at the individual financial advisor/firm performance, there can be variations that range from negligible to meaningful patterns.
As you view this data and interpret results, take into account that your firm’s unique performance may be different from what we’ve seen here.
If you’re interested in learning more about Advisor.com and how we can help grow your financial advising business, take a look at our vetting process and schedule a demo if you think our team could be a good addition to yours.